Chris Ridley (G8GKC), Bob Rogers (M0KKW) and Ian Lockyer (2E0IAJ) from Icom UK give an overview of the IC-7300 HF/50/70MHz transceiver, Icom's first Software Defined Radio (SDR) HF radio.
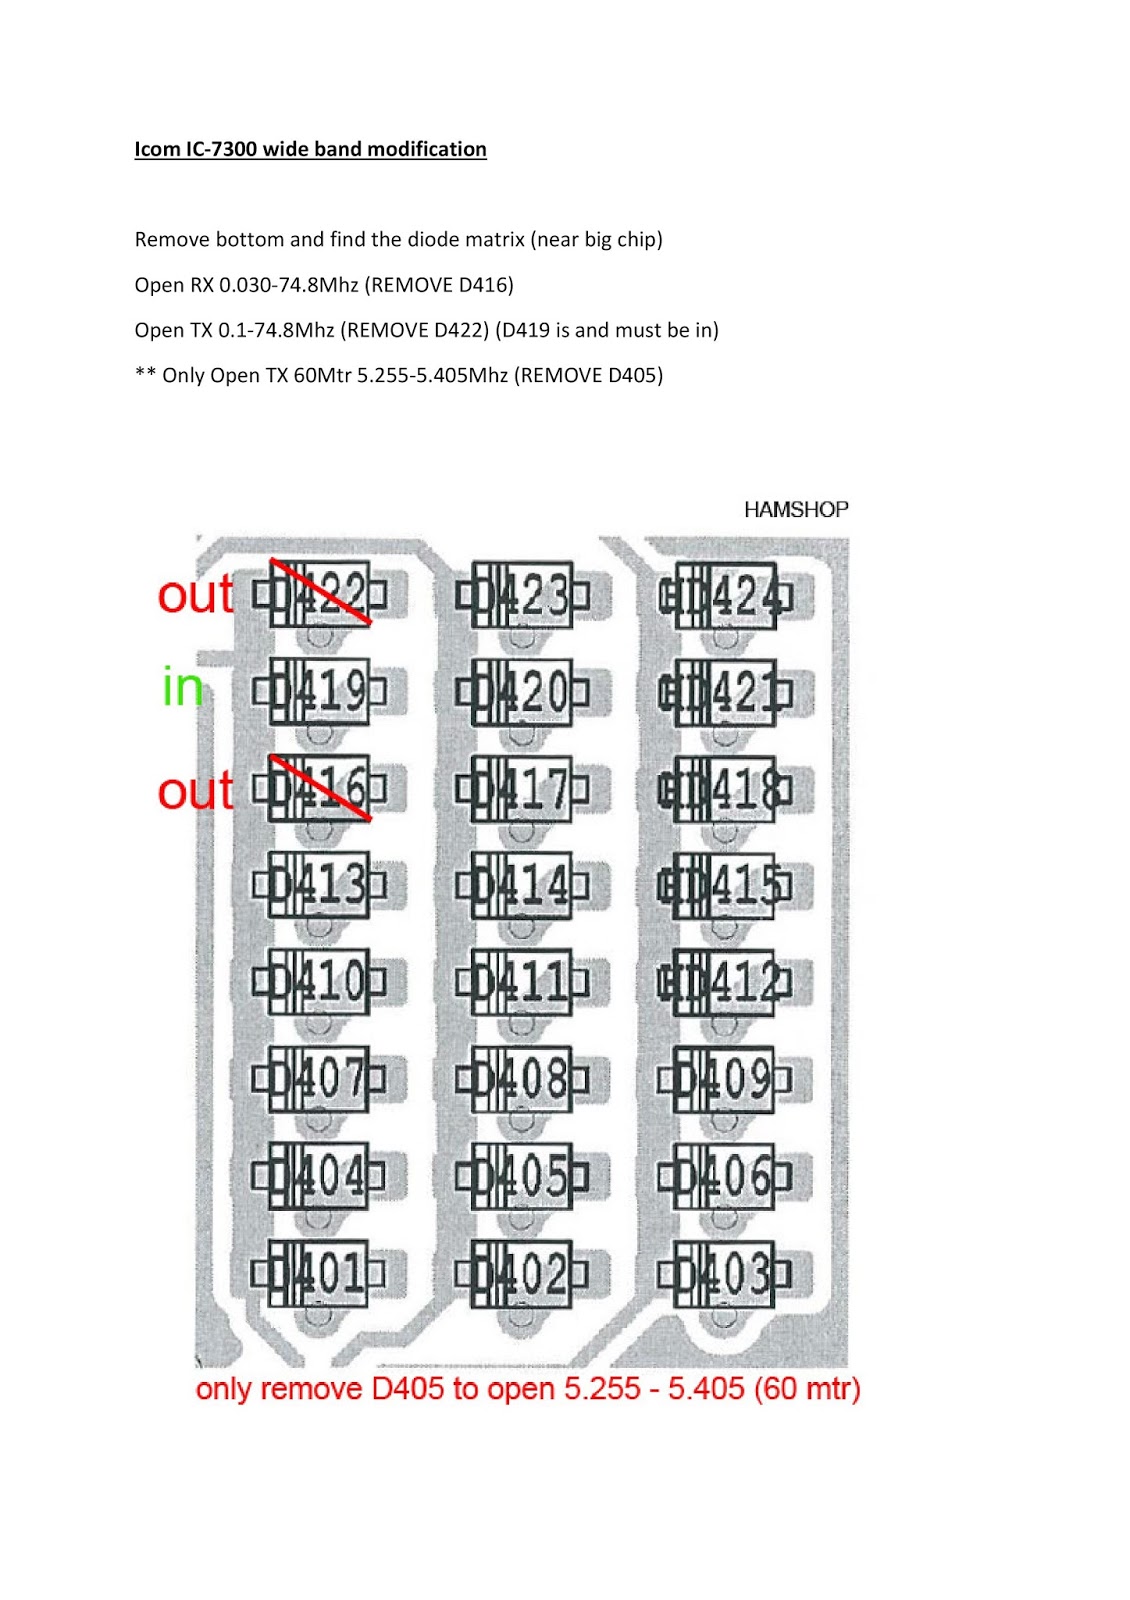
Icom IC-7300 wide band modification by PA2DB:
Great resource page compiled by Adam Farson VA7OJ/AB4OJ
Would you like a copy of the World Wide Radio Group club call roster? It covers the period between 1978, the year the club was founded to 1991. It comprises of 3 PDF files including all the club operators in the world. Names and call signs are listed by country division number. It has the number chart the group used back in the day before the Alfa Tango group rearranged them making 1 division Italy instead of Canada :-) All you have to do is send an Email request and we will be happy to oblige. We look forward to hearing from you. P.S. Its believed to be the last directory produced but we would love to find a later one, so check your attic! P.P.S. While your searching can you check your QSL cards for any from WWRG members, we would love to publish them on the site http://wwrg.simpsite.nl/qsl-cards
Best 73 Will 26WW10 and Rob 19WW409
Emails to Rob ssbradio@xs4all.nl or Will 26ww10@gmail.com
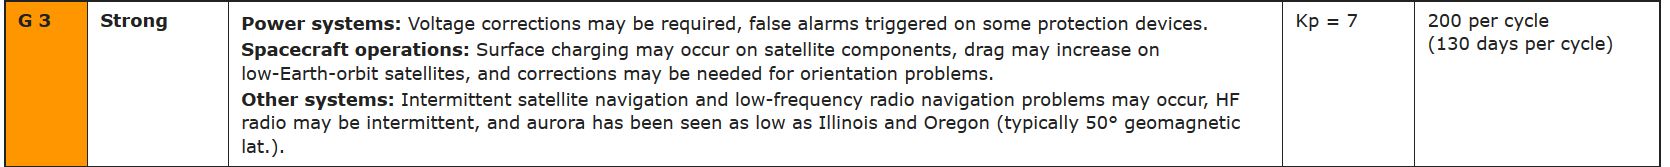
Watch the skies on Monday night between 18:00 to 21:00 GMT. G3 Magnetic storm expected and the KP index could hit K7
(ALMOST CERTAIN) CHANCE OF STORMS
NOAA forecasters estimate a 90% chance of geomagnetic storms on Nov. 2nd-3rd
when a fast-moving stream of solar wind is expected to hit Earth's
magnetic field. Solar wind speeds could exceed 800 km/s and spark a
strong G3-class geomagnetic storm
MONSTER SUNSPOT
So
you thought Halloween was over? Think again. On the sun today there is a
monster sunspot. AR2443 has more than quadrupled in size since it first
appeared on Oct. 29th, and it now stretches more than 175,000 km from
end to end. Philippe Tosi took this picture of the active region on Nov.
1st from his backyard observatory in Nîmes, France:
Stretching more than 108,739 mi (175,000 km) across, AR2443 poses a risk for M and X class solar flares.
The sunspot has more than a
dozen dark cores, many of which are as large as terrestrial
continents--and a couple as large as Earth itself. These dimensions make
it an easy target for backyard solar telecopes.
Of greater interest is the
sunspot's potential for explosive activity. The spotty complex has a
'beta-gamma-delta' magnetic field that harbors energy for strong M- and X-class flares. Any such explosions will be geoeffective as the sunspot turns squarely toward Earth in the days ahead.
Joint USAF/NOAA Solar Geophysical Activity Report and Forecast 1 November 2015
Joint USAF/NOAA Solar Geophysical Activity Report and Forecast
SDF Number 305 Issued at 2200Z on 01 Nov 2015
IA. Analysis of Solar Active Regions and Activity from 31/2100Z to
01/2100Z: Solar activity has been at low levels for the past 24 hours.
The largest solar event of the period was a C6 event observed at
01/0027Z from Region 2443 (N07E29). There are currently 4 numbered
sunspot regions on the disk.
IB. Solar Activity Forecast: Solar activity is likely to be moderate
with a slight chance for an X-class flare on days one, two, and three
(02 Nov, 03 Nov, 04 Nov).
IIA. Geophysical Activity Summary 31/2100Z to 01/2100Z: The
geomagnetic field has been at quiet to unsettled levels for the past 24
hours. Solar wind speed, as measured by the ACE spacecraft, reached a
peak speed of 396 km/s at 01/0345Z. Total IMF reached 10 nT at 01/0454Z.
The maximum southward component of Bz reached -7 nT at 01/0428Z.
IIB. Geophysical Activity Forecast: The geomagnetic field is expected
to be at unsettled to severe storm levels on day one (02 Nov), active
to major storm levels on day two (03 Nov) and unsettled to active levels
on day three (04 Nov).
III. Event probabilities 02 Nov-04 Nov
Class M 55/55/55
Class X 15/15/15
Proton 01/01/01
PCAF green
IV. Penticton 10.7 cm Flux
Observed 01 Nov 124
Predicted 02 Nov-04 Nov 120/120/120
90 Day Mean 01 Nov 104
V. Geomagnetic A Indices
Observed Afr/Ap 31 Oct 006/004
Estimated Afr/Ap 01 Nov 010/011
Predicted Afr/Ap 02 Nov-04 Nov 036/065-033/050-015/020
VI. Geomagnetic Activity Probabilities 02 Nov-04 Nov
A. Middle Latitudes
Active 20/25/35
Minor Storm 35/40/15
Major-severe storm 40/30/01
B. High Latitudes
Active 01/05/10
Minor Storm 10/10/30
Major-severe storm 90/85/50
Friday 09th of October 2015 World Wide Radio Group Update After an email conversation with Rob 19WW409 reminiscing about the good old days of radio Rob has set up a WWRG web site to celebrate and share memories of this once great Radio group. Its here http://wwrg.simpsite.nl/
If you have any pictures, QSL cards or memories from the past you would like to share we would be grateful. Send to :- ssbradio@xs4all.nl
Here is a simple but elegant solution for a DIY Head unit to fit on a tower or even a pole.
It uses mostly off the shelf components and no welding is required.
The main cage support uses 4 X M16 Stainless steel threaded rods with matching nuts and washers
The platform, mid and top bearing support uses 3 X 8mm thick by 250mm square aluminum plates.
Making it light in weight with no compromise on strength.
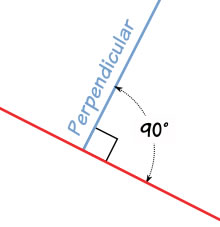
The most important consideration with any type of head unit is that the Rotator platform needs to be perpendicular to the thrust bearing at the top, any misalignment on the bottom platform means that when the stub mast turns in the Rotator it will not be vertical to the middle and top plates and could bind and damage the Rotator.
A picture is worth a thousand words
The beauty of this design is the fact you can align the cage to pin point accuracy because of the thread and nut construction.
If you haven't subscribed to his YouTube Channel you should
Published on 10 Jul 2015
This
Members-Only content from Suspicious0bservers.org has been shared on
YouTube because it describes and frames what is probably the single most
significant heliophysics discovery of the year. The subject of a coming
grand minimum, despite some of the experts' concurrence and the data
suggesting only one near-term outcome for the sun, has drawn controversy
from many in the heliophysics community; I have fallen on the side of a
coming grand minimum and am not shy about my praise for this
mathematical model. I don't like most models; they tend not to match
observational data - this one does.
The Maunder Minimum, also known as the "prolonged sunspot minimum", is the name used for the period starting in about 1645 and continuing to about 1715 when sunspots became exceedingly rare, as noted by solar observers of the time.
The term was introduced after John A. Eddy published a landmark 1976 paper in Science.[1] Astronomers before Eddy had also named the period after the solar astronomers Annie Maunder (1868-1947) and E. Walter Maunder (1851–1928) who studied how sunspot latitudes changed with time.[2] The period the husband and wife team examined included the second half of the 17th century. Two papers were published in Edward Maunder's name in 1890 and 1894, and he cited earlier papers written by Gustav Spörer.[3] Due to the social climate of the time, Annie's contribution was not publicly recognized.[4]
Spörer noted that during one 30-year period within the Maunder Minimum observations showed fewer than 50 sunspots, as opposed to a more typical 40,000–50,000 spots in modern times.[5]
Like the Dalton Minimum and Spörer Minimum, the Maunder Minimum coincided with a period of lower-than-average European temperatures.
It caused London's River Thames to freeze over, and 'frost fairs' became popular.
This period of solar inactivity also corresponds to a climatic period called the 'Little Ice Age' when rivers that are normally ice-free froze and snow fields remained year-round at lower altitudes.
There is evidence that the Sun has had similar periods of inactivity in the more distant past, Nasa says.
The Frozen Thames, 1677
The connection between solar activity and terrestrial climate is an area of on-going research.
Some scientists hypothesize that the dense wood used in Stradivarius instruments was caused by slow tree growth during the cooler period.
Instrument maker Antonio Stradivari was born a year before the start of the Maunder Minimum.
Sunspot observations
The Maunder Minimum occurred between 1645 and 1715 when very few sunspots were observed. This was not due to a lack of observations; during the 17th century, Giovanni Domenico Cassini carried out a systematic program of solar observations at the Observatoire de Paris, thanks to the astronomers Jean Picard and Philippe de La Hire. Johannes Hevelius also performed observations on his own. The total numbers of sunspots (but not Wolf numbers) in different years were as follows:
Year Sunspots
1610 9
1620 6
1630 9
1640 0
1650 3
1660 Some sunspots reported by Jan Heweliusz in Machina Coelestis
1670 0
1680 1 huge sunspot observed by Giovanni Domenico Cassini
During the Maunder Minimum enough sunspots were sighted so that 11-year cycles could be extrapolated from the count. The maxima occurred in 1676, 1684, 1695, 1705 and 1716.
The sunspot activity was then concentrated in the southern hemisphere of the Sun, except for the last cycle when the sunspots appeared in the northern hemisphere, too.
According to Spörer's law, at the start of a cycle, spots appear at ever lower latitudes until they average at about latitude 15° at solar maximum. The average then continues to drift lower to about 7° and after that, while spots of the old cycle fade, new cycle spots start appearing again at high latitudes.
The visibility of these spots is also affected by the velocity of the sun's surface rotation at various latitudes:
Visibility is somewhat affected by observations being done from the
ecliptic. The ecliptic is inclined 7° from the plane of the Sun's
equator (latitude 0°).
Solar latitude Rotation period
(days)
0° 24.7
35° 26.7
40° 28.0
75° 33.0
Little Ice Age
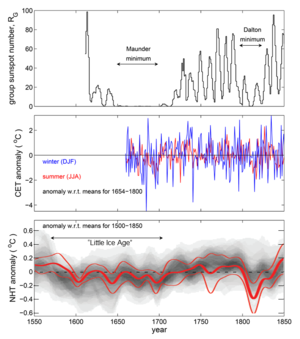
Comparison of group sunspot numbers (top), Central England Temperature
(CET) observations (middle) and reconstructions and modeling of Northern
Hemisphere Temperatures (NHT). The CET in red are summer averages (for
June, July and August) and in blue winter averages (for December of
previous year, January and February). NHT in grey is the distribution
from basket of paleoclimate reconstructions (darker grey showing higher
probability values) and in red are from model simulations that account
for solar and volcanic variations. By way of comparison, on the same
scales the anomaly for modern data (after 31 December 1999) for summer
CET is +0.65oC, for winter CET is +1.34oC, and for NHT is +1.08oC. Sunspot data are as in supplementary data to and Central England Temperature data are as published by the UK Met Office The NHT data are described in box TS.5, Figure 1 of the IPCC AR5 report of Working Group 1.
The Maunder Minimum coincided with the middle part of the Little Ice Age,
during which Europe and North America experienced very cold winters. A
causal connection between low sunspot activity and cold European winters
has recently been made using the longest existing surface temperature
record, the Central England Temperature record and also using the ERA-40 re-analysis dataset.
A potential explanation of this has been offered by observations by NASA's Solar Radiation and Climate Experiment, which suggest that solar UV output is more variable over the course of the solar cycle than scientists had previously thought In 2011, an article was published in the Nature Geoscience
journal that uses a climate model with stratospheric layers and the
SORCE data to tie low solar activity to jet stream behavior and mild
winters in some places (southern Europe and Canada/Greenland) and colder
winters in others (northern Europe and the United States). In Europe, examples of very cold winters are 1683-4, 1694-5, and the winter of 1708–9. In such years, River Thames frost fairs were held. However the Thames ceased to freeze in the 19th century largely because the removal of the "Old" (medieval) London Bridge in 1825 dramatically increased the river's flow into the Pool of London.
The original 800–900 feet (240–270 m) bridge stood upon 19 irregularly
spaced arches that were set into the river bed on large starlings. It acted as a weir holding back the slack upstream waters from the tidal brackish, salt water downstream. The construction of Thames Embankment (began 1862) further increased the river's hydrological flow by narrowing the width of waterway through the centre of capital.
Note that the term "Little Ice Age" applied to the Maunder minimum is
something of a misnomer as it implies a period of unremitting cold (and
on a global scale), which is not the case. For example, the coldest
winter in the Central England Temperature
record is 1683-4, but the winter just 2 years later (both in the middle
of the Maunder minimum) was the fifth warmest in the whole 350-year CET
record. Furthermore, summers during the Maunder minimum were not
significantly different to those seen in subsequent years. The drop in
global average temperatures in paleoclimate reconstructions at the start
of the Little Ice Age was between about 1560 and 1600, whereas the
Maunder minimum began almost 50 years later.
Other observations
Solar activity events recorded in radiocarbon.
Graph showing proxies of solar activity, including changes in sunspot number and cosmogenic isotope production.
Some scientists hypothesize that the dense wood used in Stradivarius instruments was caused by slow tree growth during the cooler period. Instrument maker Antonio Stradivari was born a year before the start of the Maunder Minimum.
Past solar activity may be recorded by various proxies including carbon-14 and beryllium-10.
These indicate lower solar activity during the Maunder Minimum. The
scale of changes resulting in the production of carbon-14 in one cycle
is small (about one percent of medium abundance) and can be taken into
account when radiocarbon dating is used to determine the age of archaeological artifacts. The interpretation of the beryllium-10 and carbon-14 cosmogenic isotope abundance records stored in terrestrial reservoirs such as ice sheets and tree rings has been greatly aided by reconstructions of solar and heliospheric magnetic fields based on historic data on Geomagnetic storm
activity, which bridge the time gap between the end of the usable
cosmogenic isotope data and the start of modern spacecraft data.
Other historical sunspot minima have been detected either directly or
by the analysis of the cosmogenic isotopes; these include the Spörer Minimum (1450–1540), and less markedly the Dalton Minimum (1790–1820). In a 2012 study, sunspot minima have been detected by analysis of carbon-14 in lake sediments.In total there seem to have been 18 periods of sunspot minima in the
last 8,000 years, and studies indicate that the sun currently spends up
to a quarter of its time in these minima.
A paper based on an analysis of a Flamsteed drawing, suggests that the Sun's surface rotation slowed in the deep Maunder minimum (1684).
During the Maunder Minimum aurorae had been observed seemingly normally, with a regular decadal-scale cycle.
This is somewhat surprising because the later, and less deep, Dalton
sunspot minimum is clearly seen in auroral occurrence frequency, at
least at lower geomagnetic latitudes.Because geomagnetic latitude is an important factor in auroral
occurrence, (lower-latitude aurorae requiring higher levels of
solar-terrestrial activity) it becomes important to allow for population
migration and other factors that may have influenced the number of
reliable auroral observers at a given magnetic latitude for the earlier
dates.Decadal-scale cycles during the Maunder minimum can also be seen in the abundances of the beryllium-10 cosmogenic isotope (which unlike carbon-14 can be studied with annual resolution) but these appear to be in antiphase with any remnant sunspot activity.
An explanation in terms of solar cycles in loss of solar magnetic flux
was proposed in 2012.
The fundamental papers on the Maunder minimum (Eddy, Legrand, Gleissberg, Schröder, Landsberg et al.) have been published in Case studies on the Spörer, Maunder and Dalton Minima.
The number of sunspots increases and decreases over time in a regular,
approximately 11-year cycle, called the sunspot cycle. The exact length
of the cycle can vary. It has been as short as eight years and as long
as fourteen, but the number of sunspots always increases over time, and
then returns to low again.
”
Irregular heartbeat of the Sun driven by double dynamo"
A new model of the Sun’s solar cycle is producing unprecedentedly accurate predictions of irregularities within the Sun’s 11-year heartbeat. The model draws on dynamo effects in two layers of the Sun, one close to the surface and one deep within its convection zone. Predictions from the model suggest that solar activity will fall by 60 per cent during the 2030s to conditions last seen during the ‘mini ice age’ that began in 1645. Results will be presented today by Prof Valentina Zharkova at the National Astronomy Meeting in Llandudno.
It is 172 years since a scientist first spotted that the Sun’s activity varies over a cycle lasting around 10 to 12 years. But every cycle is a little different and none of the models of causes to date have fully explained fluctuations. Many solar physicists have put the cause of the solar cycle down to a dynamo caused by convecting fluid deep within the Sun. Now, Zharkova and her colleagues have found that adding a second dynamo, close to the surface, completes the picture with surprising accuracy.
“We found magnetic wave components appearing in pairs, originating in two different layers in the Sun’s interior. They both have a frequency of approximately 11 years, although this frequency is slightly different, and they are offset in time. Over the cycle, the waves fluctuate between the northern and southern hemispheres of the Sun. Combining both waves together and comparing to real data for the current solar cycle, we found that our predictions showed an accuracy of 97%,” said Zharkova.
Zharkova and her colleagues derived their model using a technique called ‘principal component analysis’ of the magnetic field observations from the Wilcox Solar Observatory in California. They examined three solar cycles-worth of magnetic field activity, covering the period from 1976-2008. In addition, they compared their predictions to average sunspot numbers, another strong marker of solar activity. All the predictions and observations were closely matched.
Looking ahead to the next solar cycles, the model predicts that the pair of waves become increasingly offset during Cycle 25, which peaks in 2022. During Cycle 26, which covers the decade from 2030-2040, the two waves will become exactly out of synch and this will cause a significant reduction in solar activity.
Comparison of three images over four years apart illustrates how the level of solar activity has risen from near minimum to near maximum in the Sun's 11-years solar cycle. Credit: SOHO/ESA/NASA
Comparison of three
images over four years apart illustrates how the level of solar activity
has risen from near minimum to near maximum in the Sun's 11-years solar
cycle. Credit: SOHO/ESA/NASA
Comparison of three
images over four years apart illustrates how the level of solar activity
has risen from near minimum to near maximum in the Sun's 11-years solar
cycle. Credit: SOHO/ESA/NASA
Comparison of three
images over four years apart illustrates how the level of solar activity
has risen from near minimum to near maximum in the Sun's 11-years solar
cycle. Credit: SOHO/ESA/NASA
Comparison of three
images over four years apart illustrates how the level of solar activity
has risen from near minimum to near maximum in the Sun's 11-years solar
cycle. Credit: SOHO/ESA/NASA
“In cycle 26, the two waves exactly mirror each other – peaking at the same time but in opposite hemispheres of the Sun. Their interaction will be disruptive, or they will nearly cancel each other. We predict that this will lead to the properties of a ‘Maunder minimum’,” said Zharkova. “Effectively, when the waves are approximately in phase, they can show strong interaction, or resonance, and we have strong solar activity. When they are out of phase, we have solar minimums. When there is full phase separation, we have the conditions last seen during the Maunder minimum, 370 years ago.
Solar minimum could bring cold winters to Europe and US, but would not hold off climate change
23 Jun 2015, 16:00
Robert McSweeney
Winter sun | Flickr
Over the past few decades, our Sun has been
relatively active, giving off high levels of the solar radiation
that warms the Earth. However, in recent years this peak activity
has tailed off, prompting scientists to wonder if the Sun is
heading into a period of lower output.
A new study says even if the Sun's activity did
drop off for a while, it wouldn't have much impact on rising global
temperatures. But it could mean a higher chance of a chilly winter
in Europe and the US, the researchers say.
Solar output
The Sun's activity rises and falls on an
approximately 11-year cycle, but it can experience longer
variations from one century to another. Over the past 10,000 years,
the Sun has hit around 30 periods of very high or very low activity
- called 'grand maxima' and 'grand minima'.
One of these occurred between 1645 and 1715,
when the Sun went through a prolonged spell of
low solar activity, known as the
Maunder Minimum. This didn't have much of an
effect on global climate, but it was linked to a number of
very cold winters in Europe.
In 2010, scientists
predicted an 8% chance that we could return
to Maunder Minimum conditions within the next 40 years.
But since that study was published, solar
activity has declined further, and this likelihood has increased to
15 or 20%, says new research published today in open-access
journal Nature
Communications.
In fact, the Sun's output has declined faster
than any time in our 9,300-year record, say the researchers. And so
they set out to analyse what this could mean for global and
regional climate.
Small decrease
The researchers used a climate model to run two
scenarios where solar activity declines to a grand minimum. They
then compared the results with a control scenario where the Sun
continues on its regular cycle.
For all model runs they used the
RCP8.5 scenario to account for future climate
change - this is the scenario with the highest greenhouse gas
emissions of those used by the Intergovernmental Panel on Climate
Change (
IPCC). Global emissions are currently
tracking just above this
scenario.
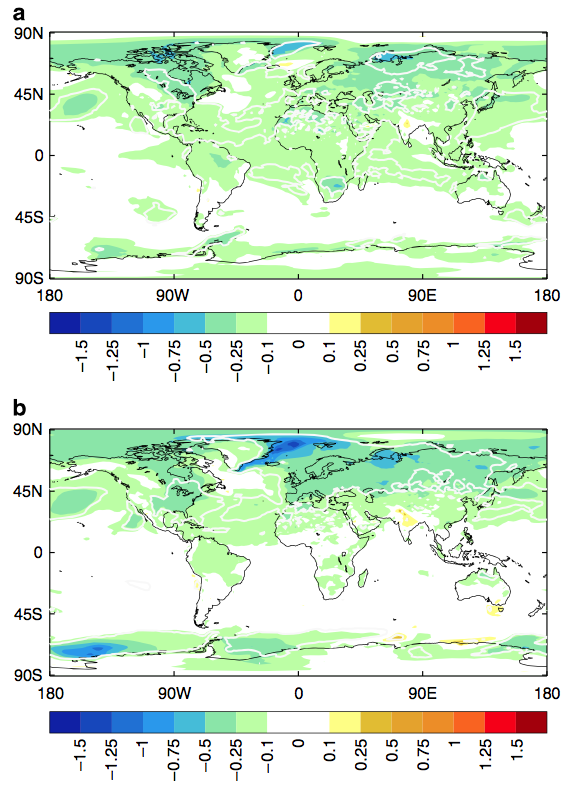
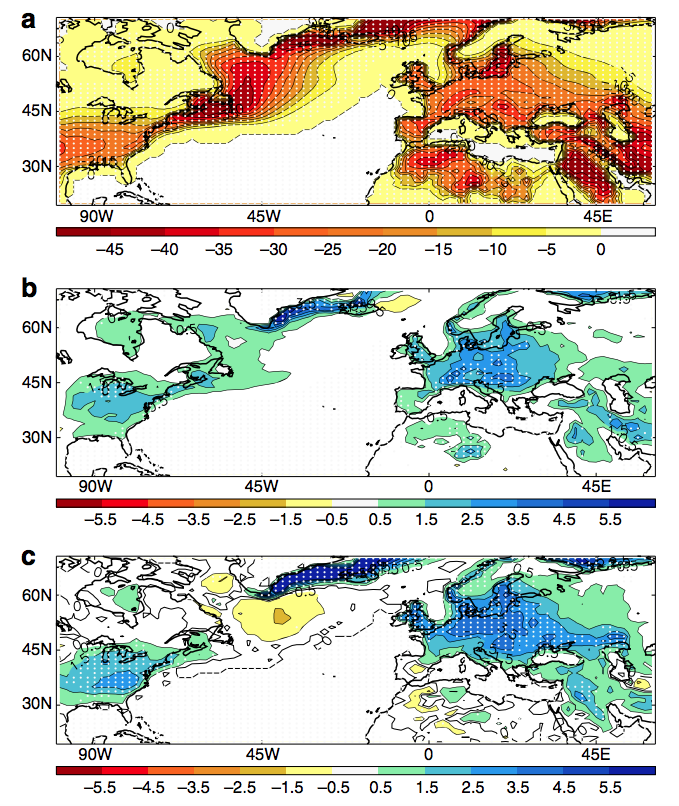
You can see the modelling results in the maps
below. Overall, a grand solar minimum could see global average
temperature rise trimmed by around 0.12C for the second half of
this century, the researchers say. Larger changes (shown as dark
greens and blues) are seen in some parts of the
northern
hemisphere
Projected difference in annual average
surface temperature for 2050-99 between RCP8.5 emissions scenario
and a) Solar scenario 1 and b) Solar scenario 2. Areas of blue and
green show regions projected to be cooler because of the solar
minimum. Source: Ineson, S. et al. (2015)
This wouldn't make much of a dent in global
temperature increases that could well exceed
four degrees by the end of the century under RCP8.5, says lead
author
Sarah Ineson, a climate scientist at the UK Met
Office.
These results are in keeping with
similar
studies, she tells Carbon
Brief:
"The expected decrease
in global mean surface temperature due to a fall in solar
irradiation would be small in comparison to the projected
anthropogenic warming."
Under the RCP8.5 scenario, the solar minimum
would delay warming for only a couple of years, the paper says.
This counters the claim that occasionally appears in some sections
of the
media that a solar minimum could see the
Earth head into an
ice age.
Northern hemisphere chill
While the impacts of a solar minimum are small
on a global scale, they can be larger for specific regions, the
paper finds.
How much of the Sun's radiation hits the Earth
can affect the circulation patterns over the Atlantic Ocean, Ineson
says. This can make natural fluctuations, such as the North
Atlantic Oscillation (NAO) and Arctic Oscillation (AO), more
negative, which can affect the winters here in the northern
hemisphere, she says:
"A more negative Arctic
Oscillation or North Atlantic Oscillation is associated with
reduced westerly winds over the North Atlantic sector and a
southward shift in the mid-latitude storm track which causes
reduced temperatures in the US and northern Europe."
You can see in the top map of the figure below
that climate change is likely to cause a large decrease in frost
days across the northern hemisphere winter. But as the second and
third maps show, a solar minimum could add another five days of
frost per year in much of Europe and the US. Change in average number of frost days.
Maps show difference in winter (December-February) frost days
between a) RCP8.5 model run (2050-99) and historical period
(1971-2000), b) Solar minimum Scenario 1 and RCP8.5, and c) Solar
minimum Scenario 2 and RCP8.5. Source: Ineson, S. et al. (2015)
For Europe, specifically, the study finds the
solar minimum could knock 0.4-0.8C off a projected winter
temperature rise of 6.6C, under RCP8.5 and relative to
1971-2000.
Shifting of the storm track across the Atlantic
Ocean would also mean less rainfall coming to northern Europe in
winter, the study says, slightly reducing the increases projected
under climate change.
Temporary effect
With only small impacts on global climate, the
study shows that a drop in the Sun's strength shouldn't delay
action on climate change, says Prof Joanna
Haigh, co-director of the Grantham Institute for
Climate Change at Imperial College London, who wasn't involved in
the study. She tells Carbon Brief:
"No one should consider
the results to provide justification for bothering less about
carbon dioxide emissions."
And any impact of a solar minimum on climate
would be short-lived, says Haigh, until such time that the Sun's
activity increased again.
Prof Jerry
Meehl, from the National Centre for Atmospheric
Science (NCAR) in Boulder, Colorado, who also wasn't involved,
agrees. He tells Carbon Brief that his recent
study shows the rebound effect on
temperatures is important:
"When the grand solar
minimum ends, the climate system warms back up to the levels it
would have been if there had never been a grand solar minimum. Thus
the effects would be temporary."
So it seems that a dip in the Sun's activity
would only have a limited impact on global climate, and wouldn't
call a halt to human-caused climate change.
Ineson, S. et al. (2015) Regional climate impacts of a
possible future grand solar minimum. Nature Communications, doi:10.1038/ncomms8535


