Showing posts with label Solar Activity. Show all posts

Sunday, 12 July 2015

The Sun is Going to Sleep...Are we heading for a Solar Minimum

Thanks to Ben at Suspicious0bservers.org
If you haven't subscribed to his YouTube Channel you should


Published on 10 Jul 2015
This Members-Only content from Suspicious0bservers.org has been shared on YouTube because it describes and frames what is probably the single most significant heliophysics discovery of the year. The subject of a coming grand minimum, despite some of the experts' concurrence and the data suggesting only one near-term outcome for the sun, has drawn controversy from many in the heliophysics community; I have fallen on the side of a coming grand minimum and am not shy about my praise for this mathematical model. I don't like most models; they tend not to match observational data - this one does.

Video Articles:
New Model Says Minimum is Coming: http://phys.org/news/2015-07-irregula...
Solar N/S Divide Article: http://phys.org/news/2015-07-solar-ma...
Observing the Frontier Conference: https://www.eventjoy.com/e/suspicious...

www.Suspicious0bservers.org
www.SpaceWeatherNews.com
www.MagneticReversal.org
www.ObservatoryProject.com
www.EarthChangesMedia.com

THE MAUNDER MINIMUM


The Maunder Minimum, also known as the "prolonged sunspot minimum", is the name used for the period starting in about 1645 and continuing to about 1715 when sunspots became exceedingly rare, as noted by solar observers of the time. The term was introduced after John A. Eddy published a landmark 1976 paper in Science.[1] Astronomers before Eddy had also named the period after the solar astronomers Annie Maunder (1868-1947) and E. Walter Maunder (1851–1928) who studied how sunspot latitudes changed with time.[2] The period the husband and wife team examined included the second half of the 17th century. Two papers were published in Edward Maunder's name in 1890 and 1894, and he cited earlier papers written by Gustav Spörer.[3] Due to the social climate of the time, Annie's contribution was not publicly recognized.[4] Spörer noted that during one 30-year period within the Maunder Minimum observations showed fewer than 50 sunspots, as opposed to a more typical 40,000–50,000 spots in modern times.[5] Like the Dalton Minimum and Spörer Minimum, the Maunder Minimum coincided with a period of lower-than-average European temperatures.
It caused London's River Thames to freeze over, and 'frost fairs' became popular. This period of solar inactivity also corresponds to a climatic period called the 'Little Ice Age' when rivers that are normally ice-free froze and snow fields remained year-round at lower altitudes. 
There is evidence that the Sun has had similar periods of inactivity in the more distant past, Nasa says.

The Frozen Thames, 1677

The connection between solar activity and terrestrial climate is an area of on-going research. Some scientists hypothesize that the dense wood used in Stradivarius instruments was caused by slow tree growth during the cooler period. 
Instrument maker Antonio Stradivari was born a year before the start of the Maunder Minimum.

Maunder Minimum (also known as the prolonged sunspot minimum) is the name used for the period starting in about 1645 and continuing to about 1715 when sunspots became exceedingly rare, as noted by solar observers of the time


Sunspot observations 

The Maunder Minimum occurred between 1645 and 1715 when very few sunspots were observed. This was not due to a lack of observations; during the 17th century, Giovanni Domenico Cassini carried out a systematic program of solar observations at the Observatoire de Paris, thanks to the astronomers Jean Picard and Philippe de La Hire. Johannes Hevelius also performed observations on his own. The total numbers of sunspots (but not Wolf numbers) in different years were as follows: 

Year                          Sunspots 
1610                               9 
1620                               6 
1630                               9 
1640                               0 
1650                               3 
1660                               Some sunspots reported by Jan Heweliusz in Machina Coelestis 
1670                               0 
1680                               1 huge sunspot observed by Giovanni Domenico Cassini


During the Maunder Minimum enough sunspots were sighted so that 11-year cycles could be extrapolated from the count. The maxima occurred in 1676, 1684, 1695, 1705 and 1716. The sunspot activity was then concentrated in the southern hemisphere of the Sun, except for the last cycle when the sunspots appeared in the northern hemisphere, too. According to Spörer's law, at the start of a cycle, spots appear at ever lower latitudes until they average at about latitude 15° at solar maximum. The average then continues to drift lower to about 7° and after that, while spots of the old cycle fade, new cycle spots start appearing again at high latitudes. The visibility of these spots is also affected by the velocity of the sun's surface rotation at various latitudes: 

Visibility is somewhat affected by observations being done from the ecliptic. The ecliptic is inclined 7° from the plane of the Sun's equator (latitude 0°).

Solar latitude         Rotation period (days) 
0°                                  24.7 
35°                                26.7 
40°                                28.0 
75°                                33.0


Little Ice Age
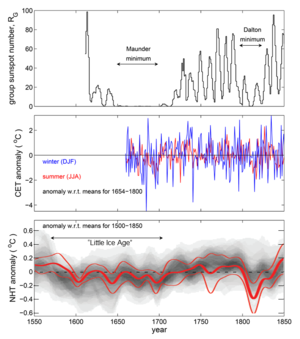

Comparison of group sunspot numbers (top), Central England Temperature (CET) observations (middle) and reconstructions and modeling of Northern Hemisphere Temperatures (NHT). The CET in red are summer averages (for June, July and August) and in blue winter averages (for December of previous year, January and February). NHT in grey is the distribution from basket of paleoclimate reconstructions (darker grey showing higher probability values) and in red are from model simulations that account for solar and volcanic variations. By way of comparison, on the same scales the anomaly for modern data (after 31 December 1999) for summer CET is +0.65oC, for winter CET is +1.34oC, and for NHT is +1.08oC. Sunspot data are as in supplementary data to and Central England Temperature data are as published by the UK Met Office The NHT data are described in box TS.5, Figure 1 of the IPCC AR5 report of Working Group 1.
The Maunder Minimum coincided with the middle part of the Little Ice Age, during which Europe and North America experienced very cold winters. A causal connection between low sunspot activity and cold European winters has recently been made using the longest existing surface temperature record, the Central England Temperature record and also using the ERA-40 re-analysis dataset.
A potential explanation of this has been offered by observations by NASA's Solar Radiation and Climate Experiment, which suggest that solar UV output is more variable over the course of the solar cycle than scientists had previously thought In 2011, an article was published in the Nature Geoscience journal that uses a climate model with stratospheric layers and the SORCE data to tie low solar activity to jet stream behavior and mild winters in some places (southern Europe and Canada/Greenland) and colder winters in others (northern Europe and the United States). In Europe, examples of very cold winters are 1683-4, 1694-5, and the winter of 1708–9. In such years, River Thames frost fairs were held. However the Thames ceased to freeze in the 19th century largely because the removal of the "Old" (medieval) London Bridge in 1825 dramatically increased the river's flow into the Pool of London. The original 800–900 feet (240–270 m) bridge stood upon 19 irregularly spaced arches that were set into the river bed on large starlings. It acted as a weir holding back the slack upstream waters from the tidal brackish, salt water downstream. The construction of Thames Embankment (began 1862) further increased the river's hydrological flow by narrowing the width of waterway through the centre of capital.
Note that the term "Little Ice Age" applied to the Maunder minimum is something of a misnomer as it implies a period of unremitting cold (and on a global scale), which is not the case. For example, the coldest winter in the Central England Temperature record is 1683-4, but the winter just 2 years later (both in the middle of the Maunder minimum) was the fifth warmest in the whole 350-year CET record. Furthermore, summers during the Maunder minimum were not significantly different to those seen in subsequent years. The drop in global average temperatures in paleoclimate reconstructions at the start of the Little Ice Age was between about 1560 and 1600, whereas the Maunder minimum began almost 50 years later.


Other observations

Solar activity events recorded in radiocarbon.

Graph showing proxies of solar activity, including changes in sunspot number and cosmogenic isotope production.
Some scientists hypothesize that the dense wood used in Stradivarius instruments was caused by slow tree growth during the cooler period. Instrument maker Antonio Stradivari was born a year before the start of the Maunder Minimum.
Past solar activity may be recorded by various proxies including carbon-14 and beryllium-10.
These indicate lower solar activity during the Maunder Minimum. The scale of changes resulting in the production of carbon-14 in one cycle is small (about one percent of medium abundance) and can be taken into account when radiocarbon dating is used to determine the age of archaeological artifacts. The interpretation of the beryllium-10 and carbon-14 cosmogenic isotope abundance records stored in terrestrial reservoirs such as ice sheets and tree rings has been greatly aided by reconstructions of solar and heliospheric magnetic fields based on historic data on Geomagnetic storm activity, which bridge the time gap between the end of the usable cosmogenic isotope data and the start of modern spacecraft data.
Other historical sunspot minima have been detected either directly or by the analysis of the cosmogenic isotopes; these include the Spörer Minimum (1450–1540), and less markedly the Dalton Minimum (1790–1820). In a 2012 study, sunspot minima have been detected by analysis of carbon-14 in lake sediments.In total there seem to have been 18 periods of sunspot minima in the last 8,000 years, and studies indicate that the sun currently spends up to a quarter of its time in these minima.
A paper based on an analysis of a Flamsteed drawing, suggests that the Sun's surface rotation slowed in the deep Maunder minimum (1684).
During the Maunder Minimum aurorae had been observed seemingly normally, with a regular decadal-scale cycle. This is somewhat surprising because the later, and less deep, Dalton sunspot minimum is clearly seen in auroral occurrence frequency, at least at lower geomagnetic latitudes. Because geomagnetic latitude is an important factor in auroral occurrence, (lower-latitude aurorae requiring higher levels of solar-terrestrial activity) it becomes important to allow for population migration and other factors that may have influenced the number of reliable auroral observers at a given magnetic latitude for the earlier dates. Decadal-scale cycles during the Maunder minimum can also be seen in the abundances of the beryllium-10 cosmogenic isotope (which unlike carbon-14 can be studied with annual resolution) but these appear to be in antiphase with any remnant sunspot activity. An explanation in terms of solar cycles in loss of solar magnetic flux was proposed in 2012.
The fundamental papers on the Maunder minimum (Eddy, Legrand, Gleissberg, Schröder, Landsberg et al.) have been published in Case studies on the Spörer, Maunder and Dalton Minima.


The number of sunspots increases and decreases over time in a regular, approximately 11-year cycle, called the sunspot cycle. The exact length of the cycle can vary. It has been as short as eight years and as long as fourteen, but the number of sunspots always increases over time, and then returns to low again.


” Irregular heartbeat of the Sun driven by double dynamo" 
   July 9, 2015 by Dr Robert Massey 


A new model of the Sun’s solar cycle is producing unprecedentedly accurate predictions of irregularities within the Sun’s 11-year heartbeat. The model draws on dynamo effects in two layers of the Sun, one close to the surface and one deep within its convection zone. Predictions from the model suggest that solar activity will fall by 60 per cent during the 2030s to conditions last seen during the ‘mini ice age’ that began in 1645. Results will be presented today by Prof Valentina Zharkova at the National Astronomy Meeting in Llandudno. It is 172 years since a scientist first spotted that the Sun’s activity varies over a cycle lasting around 10 to 12 years. But every cycle is a little different and none of the models of causes to date have fully explained fluctuations. Many solar physicists have put the cause of the solar cycle down to a dynamo caused by convecting fluid deep within the Sun. Now, Zharkova and her colleagues have found that adding a second dynamo, close to the surface, completes the picture with surprising accuracy. “We found magnetic wave components appearing in pairs, originating in two different layers in the Sun’s interior. They both have a frequency of approximately 11 years, although this frequency is slightly different, and they are offset in time. Over the cycle, the waves fluctuate between the northern and southern hemispheres of the Sun. Combining both waves together and comparing to real data for the current solar cycle, we found that our predictions showed an accuracy of 97%,” said Zharkova. Zharkova and her colleagues derived their model using a technique called ‘principal component analysis’ of the magnetic field observations from the Wilcox Solar Observatory in California. They examined three solar cycles-worth of magnetic field activity, covering the period from 1976-2008. In addition, they compared their predictions to average sunspot numbers, another strong marker of solar activity. All the predictions and observations were closely matched. Looking ahead to the next solar cycles, the model predicts that the pair of waves become increasingly offset during Cycle 25, which peaks in 2022. During Cycle 26, which covers the decade from 2030-2040, the two waves will become exactly out of synch and this will cause a significant reduction in solar activity.

Comparison of three images over four years apart illustrates how the level of solar activity has risen from near minimum to near maximum in the Sun's 11-years solar cycle. Credit: SOHO/ESA/NASA

Comparison of three images over four years apart illustrates how the level of solar activity has risen from near minimum to near maximum in the Sun's 11-years solar cycle. Credit: SOHO/ESA/NASA

Read more at: http://phys.org/news/2015-07-irregular-heartbeat-sun-driven-dynamo.html#jCp
Comparison of three images over four years apart illustrates how the level of solar activity has risen from near minimum to near maximum in the Sun's 11-years solar cycle. Credit: SOHO/ESA/NASA

Read more at: http://phys.org/news/2015-07-irregular-heartbeat-sun-driven-dynamo.html#jCp
Comparison of three images over four years apart illustrates how the level of solar activity has risen from near minimum to near maximum in the Sun's 11-years solar cycle. Credit: SOHO/ESA/NASA

Read more at: http://phys.org/news/2015-07-irregular-heartbeat-sun-driven-dynamo.html#jCp
Comparison of three images over four years apart illustrates how the level of solar activity has risen from near minimum to near maximum in the Sun's 11-years solar cycle. Credit: SOHO/ESA/NASA

Read more at: http://phys.org/news/2015-07-irregular-heartbeat-sun-driven-dynamo.html#jCp
 “In cycle 26, the two waves exactly mirror each other – peaking at the same time but in opposite hemispheres of the Sun. Their interaction will be disruptive, or they will nearly cancel each other. We predict that this will lead to the properties of a ‘Maunder minimum’,” said Zharkova. “Effectively, when the waves are approximately in phase, they can show strong interaction, or resonance, and we have strong solar activity. When they are out of phase, we have solar minimums. When there is full phase separation, we have the conditions last seen during the Maunder minimum, 370 years ago.


From  The Carbon Brief

Solar minimum could bring cold winters to Europe and US, but would not hold off climate change

  • 23 Jun 2015, 16:00
  • Robert McSweeney
Low winter sun over a common
 Winter sun | Flickr

Over the past few decades, our Sun has been relatively active, giving off high levels of the solar radiation that warms the Earth. However, in recent years this peak activity has tailed off, prompting scientists to wonder if the Sun is heading into a period of lower output.
A new study says even if the Sun's activity did drop off for a while, it wouldn't have much impact on rising global temperatures. But it could mean a higher chance of a chilly winter in Europe and the US, the researchers say.

Solar output

The Sun's activity rises and falls on an approximately 11-year cycle, but it can experience longer variations from one century to another. Over the past 10,000 years, the Sun has hit around 30 periods of very high or very low activity - called 'grand maxima' and 'grand minima'.
One of these occurred between 1645 and 1715, when the Sun went through a prolonged spell of low solar activity, known as the Maunder Minimum. This didn't have much of an effect on global climate, but it was linked to a number of very cold winters in Europe.
In 2010, scientists predicted an 8% chance that we could return to Maunder Minimum conditions within the next 40 years.
But since that study was published, solar activity has declined further, and this likelihood has increased to 15 or 20%, says new research published today in open-access journal Nature Communications.
In fact, the Sun's output has declined faster than any time in our 9,300-year record, say the researchers. And so they set out to analyse what this could mean for global and regional climate.

Small decrease

The researchers used a climate model to run two scenarios where solar activity declines to a grand minimum. They then compared the results with a control scenario where the Sun continues on its regular cycle.
For all model runs they used the RCP8.5 scenario to account for future climate change - this is the scenario with the highest greenhouse gas emissions of those used by the Intergovernmental Panel on Climate Change ( IPCC). Global emissions are currently tracking just above this scenario.
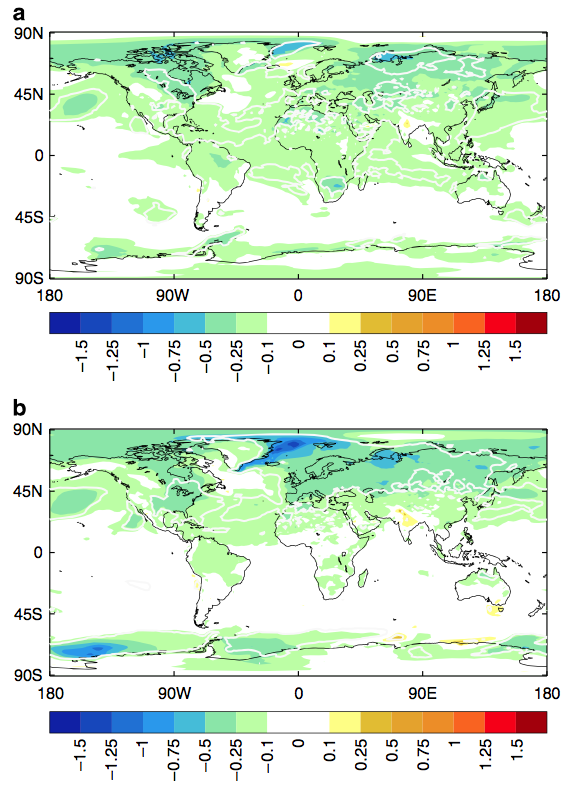
You can see the modelling results in the maps below. Overall, a grand solar minimum could see global average temperature rise trimmed by around 0.12C for the second half of this century, the researchers say. Larger changes (shown as dark greens and blues) are seen in some parts of  the
northern hemisphere
Ineson Et Al (2015) Fig2
  
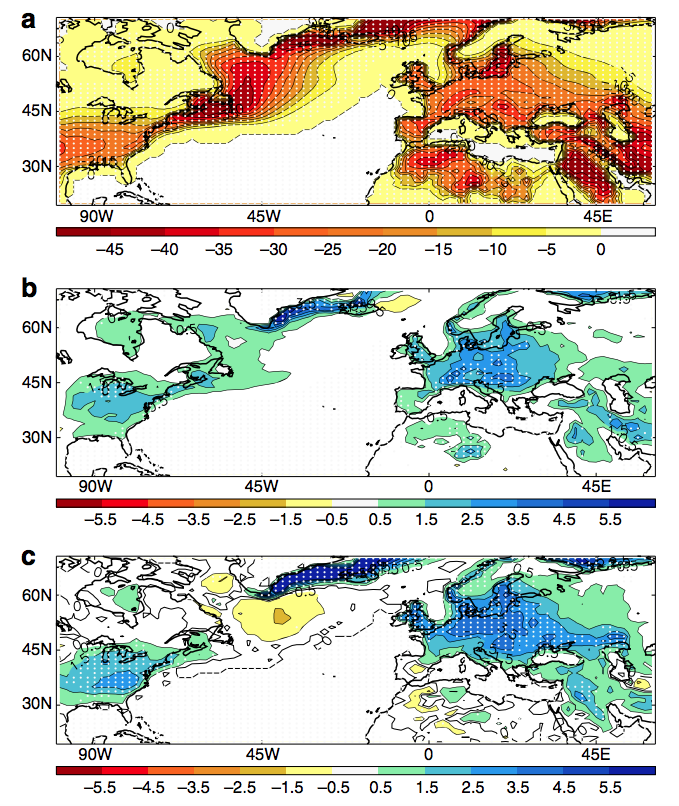
Projected difference in annual average surface temperature for 2050-99 between RCP8.5 emissions scenario and a) Solar scenario 1 and b) Solar scenario 2. Areas of blue and green show regions projected to be cooler because of the solar minimum. Source: Ineson, S. et al. (2015)
This wouldn't make much of a dent in global temperature increases that could well exceed four degrees by the end of the century under RCP8.5, says lead author Sarah Ineson, a climate scientist at the UK Met Office.
These results are in keeping with similar studies, she tells Carbon Brief:
"The expected decrease in global mean surface temperature due to a fall in solar irradiation would be small in comparison to the projected anthropogenic warming."
Under the RCP8.5 scenario, the solar minimum would delay warming for only a couple of years, the paper says. This counters the claim that occasionally appears in some sections of the media that a solar minimum could see the Earth head into an ice age.

Northern hemisphere chill

While the impacts of a solar minimum are small on a global scale, they can be larger for specific regions, the paper finds.
How much of the Sun's radiation hits the Earth can affect the circulation patterns over the Atlantic Ocean, Ineson says. This can make natural fluctuations, such as the North Atlantic Oscillation (NAO) and Arctic Oscillation (AO), more negative, which can affect the winters here in the northern hemisphere, she says:
"A more negative Arctic Oscillation or North Atlantic Oscillation is associated with reduced westerly winds over the North Atlantic sector and a southward shift in the mid-latitude storm track which causes reduced temperatures in the US and northern Europe."
Ineson Et Al (2015) Fig4
You can see in the top map of the figure below that climate change is likely to cause a large decrease in frost days across the northern hemisphere winter. But as the second and third maps show, a solar minimum could add another five days of frost per year in much of Europe and the US. 
Change in average number of frost days. Maps show difference in winter (December-February) frost days between a) RCP8.5 model run (2050-99) and historical period (1971-2000), b) Solar minimum Scenario 1 and RCP8.5, and c) Solar minimum Scenario 2 and RCP8.5. Source: Ineson, S. et al. (2015)
For Europe, specifically, the study finds the solar minimum could knock 0.4-0.8C off a projected winter temperature rise of 6.6C, under RCP8.5 and relative to 1971-2000.
Shifting of the storm track across the Atlantic Ocean would also mean less rainfall coming to northern Europe in winter, the study says, slightly reducing the increases projected under climate change.

Temporary effect

With only small impacts on global climate, the study shows that a drop in the Sun's strength shouldn't delay action on climate change, says Prof Joanna Haigh, co-director of the Grantham Institute for Climate Change at Imperial College London, who wasn't involved in the study. She tells Carbon Brief:
"No one should consider the results to provide justification for bothering less about carbon dioxide emissions."
And any impact of a solar minimum on climate would be short-lived, says Haigh, until such time that the Sun's activity increased again.
Prof Jerry Meehl, from the National Centre for Atmospheric Science (NCAR) in Boulder, Colorado, who also wasn't involved, agrees. He tells Carbon Brief that his recent study shows the rebound effect on temperatures is important:
"When the grand solar minimum ends, the climate system warms back up to the levels it would have been if there had never been a grand solar minimum. Thus the effects would be temporary."
So it seems that a dip in the Sun's activity would only have a limited impact on global climate, and wouldn't call a halt to human-caused climate change.
Ineson, S. et al. (2015) Regional climate impacts of a possible future grand solar minimum. Nature Communications, doi:10.1038/ncomms8535

Thursday, 25 June 2015

Jun 25 07:24 Moderately strong CME impact


Latest Solar activity

LATEST SOLAR NEWS From http://www.spaceweatherlive.com

June 25th 09:24 G1 - Minor geomagnetic storm (Kp 5) - High latitude sky watchers have a chance to see visual aurora. The higher middle latitudes might see aurora on the northern or southern horizon, depending on which hemisphere you are located.

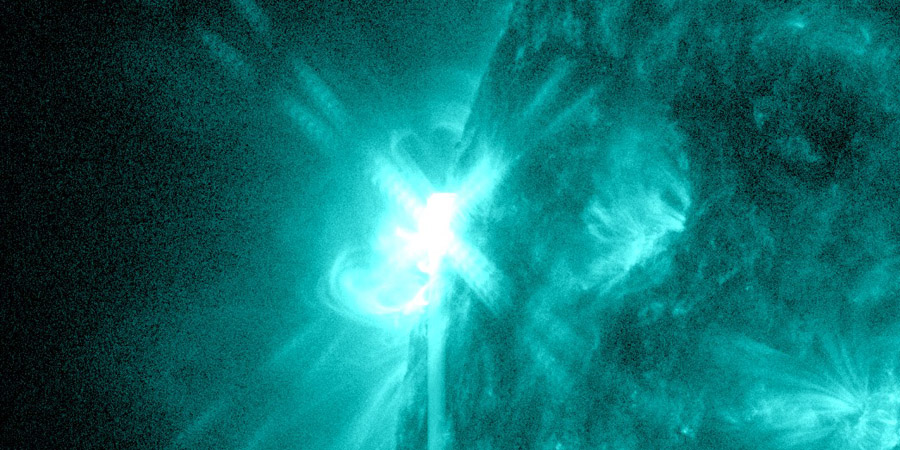
June 25th  08:33 Strong M7.9 solar flare from sunspot region

June 25th 07:24 Moderately strong CME impact A Coronal Mass Ejection (CME) has arrived at the ACE satellite. The solar wind speed rose with 83.75 km/sec to 704.8 km/sec. Solar wind speed: 704.8 km/sec and density 3.9 p/cm3 IMF Bt (strength): 14.9 nT - Bz 12 nT


LATEST SOLAR NEWS From http://spaceweathernews.com/

(June 25 1200UTC) Based on flare and C2 images my initial impact estimation window is 2200UTC
June 26 – 1600UTC June 27. I need to see CACTus and C3 images before making a final prediction. NASA and NOAA should make their estimations in a few hours.

(June 25 1033UTC) Satellite coronagraphs confirm that the CME is heading our way.

(June 25 0935UTC) M7.9 Solar Flare has erupted w/Earth-Directed CME. The CME in the solar wind has also triggered another geomagnetic storm.


 GOES Magnetometer Space Weather disruptions show as large spikes Space Weather calm shows as smooth curves


 KP Index [0-3] Green - Stable/Calm Magnetosphere. [4] Yellow - Unstable Magnetosphere. [5+] Red - Geomagnetic Storm Conditions


GOES Electron Flux This shows the High Energy Electron Bombardment. The radiation storm levels for electrons begin between 10^5 and 10^6 particle count and become significant as we approach 10^7. 

Tuesday, 23 June 2015

Second strongest storm of this cycle, M6.6 CME analysis

Tuesday, June 23 2015 - 10:39 UTC


We are still very much under the influence of the 21 June coronal mass ejection that arrived yesterday evening. The NOAA SWPC reported that the severe G4 geomagnetic storming threshold was reached and the Wing Kp-index even went up to Kp9 which stands for extreme G5 geomagnetic storm conditions, but the G5 reported by the Wing-Kp is questionable. The disturbance storm time index (another way of classifying geomagnetic storms where a lower number means a stronger storm) reached -195nT (for now at least) which makes this the second strongest geomagnetic storm of this solar cycle. The 2015/03/17 geomagnetic storm remains the strongest storm of this solarcycle with a Dst of -221 nT.
The direction of the IMF remains south at the time of this post and more geomagnetic storming is likely in the hours ahead. We have seen reports of vivid aurora displays from many places around the world. If you also witnessed an auroral display and made images or videos that you would like to share with us feel free to send them in to photos[at]spaceweatherlive.com. Thanks!

 Image: Aurora Borealis as seen from Viewmont, NY (USA) by Pete Mauney.

Image: Aurora Borealis as seen from Sparta, WI (USA) by Jacob Jones.


M6.6 coronal mass ejection analysis

Yesterday evening at the same time as the coronal mass ejection arrival, sunspot region 2371 erupted once more. This time it found the strength for an M6.6 (R2-moderate) solar flare that peaked at 18:23 UTC.

It didn't took long to come to the conclusion that this M6.6 solar flare also launched a coronal mass ejection with an earth-directed component. More about that here in our news update from yesterday evening. SOHO imagery shows us a very nice halo coronal mass ejection which is guaranteed to arrive at Earth. The animations below from SOHO shows us the full expanding halo as the plasma cloud leaves the Sun.

Animations: SOHO/LASCO C2 and C3 coronagraph animations showing the M6.6 coronal mass ejection as it leaves the Sun.

While this coronal mass ejection does not expand like a perfect symmetrical halo event as the 21 June coronal mass ejection did (this coronal mass ejection has it's bulk heading a bit north-west) we still expect a very decent impact from this event as the full halo is still well defined.
CACtus reports a speed of about 1000km/s which is only a fraction slower than the coronal mass ejection of 21 June. Considering this coronal mass ejection is traveling trough a portion of space which has pretty much been cleared of ambient solar wind by the 21 June coronal mass ejection it is possible that this coronal mass ejection does not decelerate all that much. Using the same method that we used to predict the arrival time of the June 21 CME (which arrived close to our predicted arrival time) we come to the conclusion that this plasma cloud will arrive at Earth on Wednesday 24 June at 17:00 UTC with a plus/minus of 6 hours. The solar wind speed could again increase to about 700km/s and if the direction of the IMF again turns southward (Bz) we could again experience a strong G3 geomagnetic storm with aurora displays possible at middle latitude locations like southern England, Belgium and northern parts of Germany and Poland in Europe and many of the northernmost states in the USA. With a bit of luck, even sky watchers in southern parts of New South Wales in Australia will need to be alert for possible aurora displays.

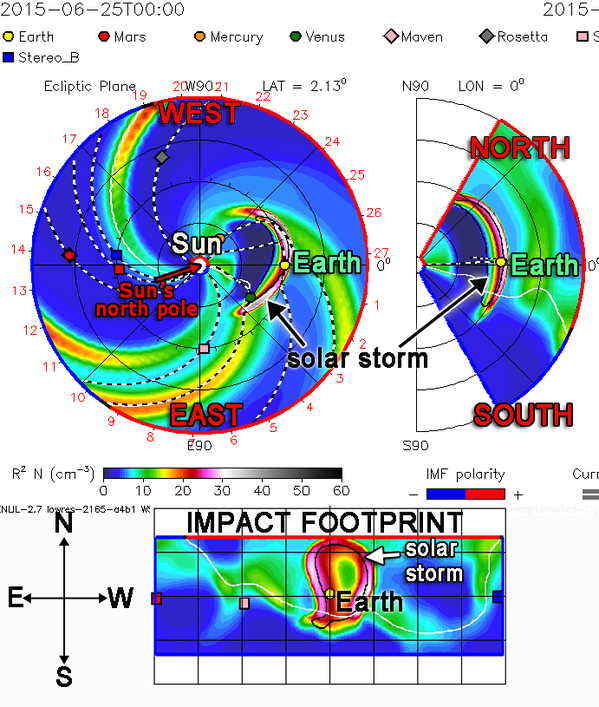
Earth-directed solar storm to hit Earth early June 25th

NASA predict model shows next Earth-directed solar storm hits early June 25! Expect ham radio, GPS issues, possible Aurora

LATEST SOLAR NEWS:
June 23rd 08:55UTC Solar flaring is easing back and so is the proton radiation. The geomagnetic disruptions remain severe and we have another CME en route from yesterdays M6.5 event. I believe the shockwave will reach earth tomorrow night, NASA and NOAA believe it will be Thursday morning.

June 23rd 00:00UTC After reviewing the SOHO LASCO images, I can confirm that the CME from today’s M6.5 is a full halo, and earth-directed. (June 22 2120UTC) KP8 (Level 4 Magnetic Storm) has set in at earth. We now have significant geomagnetic and radiation events.
http://spaceweathernews.com/


G4 - Severe geomagnetic storm (Kp 8+) - High latitude sky watchers have a very high chance to see strong aurora. The entire middle latitudes have a high chance to see aurora. The low latitudes have a chance to see aurora on the northern or southern horizon, depending on which hemisphere you are located.
http://www.spaceweatherlive.com/en/news


This chart shows the sunspots, the general magnetism around them, and the coronal holes (CH). The sunspot and CH numbers are provided as well. Red is negative, Blue is positive.
This chart is created by Solen.info (a terrific resource)

This chart shows the coronal holes currently on the earth-facing disk. The CH number is provided as well. Use this in conjunction with the chart to the right.
This chart is created by Solen.info


This chart shows the current sunspot number and tracks it since 2000. This cycle was weaker than most, one of the weakest on record. It appears we will soon descend into solar sunspot minimum, but on the descent we may see powerful (albeit fewer) solar flares.


This chart is yet another one from Solen.info – it shows the current solar cycle sunspot counts compared to previous cycles.


Radiation Storm and Strong CME Alert | S0 News June 22, 2015

Published on 22 Jun 2015
Observing the Frontier Conference: https://www.eventjoy.com/e/suspicious...

www.Suspicious0bservers.org
www.SpaceWeatherNews.com
www.MagneticReversal.org
www.ObservatoryProject.com
www.EarthChangesMedia.com [Under Construction]

Discussing Earthquakes with Kongpop: https://www.youtube.com/watch?v=ThCUZ...
Pause on Pausing the Pause: https://www.youtube.com/watch?v=CZH46...
Earth's Magnetic Reversal: https://www.youtube.com/watch?v=sIayx...
Top 6 Climate Change Problems: https://www.youtube.com/watch?v=4Ew05...
Sun Series: http://www.youtube.com/playlist?list=...
10 Amazing Solar Eruptions: https://www.youtube.com/watch?v=1qBwm...

Original music by NEMES1S
http://www.suspicious0bservers.org/shop/ [Get NEMES1S Music!]

REPEAT LINKS:

WORLD WEATHER:
Earth WindMap: http://earth.nullschool.net/#current/...
Global Maps: http://www.atmos.albany.edu/student/k...
NDBC Buoys: http://www.ndbc.noaa.gov/
HurricaneZone Satellite Images: http://www.hurricanezone.net/westpaci...
NOAA Environmental Visualization Laboratory: http://www.nnvl.noaa.gov/Default.php
Satellite Maps: http://www.woweather.com/cgi-app/sate...
Forecast Maps: http://www.woweather.com/weather/maps...
TORCON: http://www.weather.com/news/tornado-t... [Tornado Forecast for the day]
HURRICANE TRACKER: http://www.weather.com/weather/hurric...
GOES Satellites: http://rsd.gsfc.nasa.gov/goes/
THE US WINDMAP: http://hint.fm/wind/
Severe Weather Threats: http://www.weather.com/news/weather-s...
Canada Weather Office Satellite Composites: http://www.weatheroffice.gc.ca/satell...
Temperature Delta: http://www.intellicast.com/National/T...
Records/Extremes: http://www.ncdc.noaa.gov/extremes/rec...

SPACEWEATHER:
NOAA Spaceweather: http://www.swpc.noaa.gov
Spaceweather: http://spaceweather.com
SOHO Solar Wind: http://umtof.umd.edu/pm/
Planetary Orbital Diagram - Ceres1 JPL: http://ssd.jpl.nasa.gov/sbdb.cgi?sstr...
SDO: http://sdo.gsfc.nasa.gov/data/
Helioviewer: http://www.helioviewer.org/
SOHO: http://sohodata.nascom.nasa.gov/cgi-b...
Stereo: http://stereo.gsfc.nasa.gov/cgi-bin/i...
SOLARIMG: http://solarimg.org/artis/
iSWA: http://iswa.gsfc.nasa.gov/iswa/iSWA.html
NASA ENLIL SPIRAL: http://iswa.gsfc.nasa.gov:8080/IswaSy...
Gamma Ray Bursts: http://grb.sonoma.edu/
BARTOL Cosmic Rays: http://neutronm.bartol.udel.edu//spac...
ISWA: http://iswa.ccmc.gsfc.nasa.gov:8080/I...
NOAA Sunspot Classifications: http://www.swpc.noaa.gov/ftpdir/lates...
GONG: http://gong2.nso.edu/dailyimages/
GONG Magnetic Maps: http://gong.nso.edu/data/magmap/ondem...

MISC Links:
JAPAN Radiation Map: http://jciv.iidj.net/map/
RADIATION Network: http://radiationnetwork.com/
LISS: http://earthquake.usgs.gov/monitoring...
QUAKES LIST FULL: http://www.emsc-csem.org/Earthquake/s...
RSOE: http://hisz.rsoe.hu/alertmap/index2.php [That cool alert map I use]
Moon: http://www.fourmilab.ch/earthview/pac...

Sunday, 21 June 2015

NOAA Issues Another Magnetic Storm Watch -- Northern Lights Show Possible

                                                                 LATEST SOLAR NEWS: 

(June 22 1028UTC) We await the 3rd CME shockwave – proton radiation and geomagnetic effects will be the primary things to watch. Flare probabilities remain high on delta class magnetic structures in AR12371.


(June 22 0220UTC) ALERT Strong CME Impact Watch – NASA and NOAA both forecast the last, largest, and most earth-direct CME to arrive by the evening of June 22, 2015 at speeds approaching 850km/s and high density. Such an event can product a strong geomagnetic storm and perhaps even disrupt satellites, avionics, GPS, communications (basically all electronics, including the internet and your cell phone) in minor ways. This CME is almost certainly well-below grid-destroying strength.
http://spaceweathernews.com/

SUN


UPDATE 1: Storm Watch Now Extended to 48 hours.


UPDATE 2: Watch now UPGRADED to STRONG! First 24 hours, 7Kp possible. Second 24 hours, 6Kp possible.


Charged Particles from Sun heading towards Earth.


When does the Aurora storm watch begin?


      The storm watch begins on 22/06/2015 at 01:01:00

      The storm watch starts at the above time and continues for 48 hours.


http://www.softservenews.com/en/aurora-borealis-breaking-news/aurora-storm-watch-news-300066.html


Sunspot region 12371 kicking out flares


Thursday, June 18 2015 - 12:23 UTC


A coronal mass ejection (CME) is a massive burst of solar wind and magnetic fields rising above the solar corona or being released into space.
Coronal Mass Ejections take about  20 to 40 hours to reach the earth. 
CMEs can give rise to ionospheric storms. These can provide a short lived enhancement to ionospheric radio propagation conditions but before long this can result in a black out to radio communications via the ionosphere. 
Lookout for a possible Aurora, If the CME couples strongly to the Earth's magnetic field the Aurora may be visible.


Since then we have had more flares
On June the 20th at 07:09 we had a moderate M1.01 solar flare
On June the 21st at 02:00 we had a moderate M2.03 solar flare
On June the 21st at 02:57 we had a strong M2.69 solar flare
On June the 21st at 10:03 we had a strong M3.87 solar flare
On June the 21st at 18:39 we had a Moderate M1.14 solar flare
All were from from sunspot region 12371


Dr. Tamitha Skov ‏@TamithaSkov Tweeted
M-flare is double peaked & rises to M2.2! Launching Earth-directed solarstorm now! Likely impact at Earth June 24-25!


Halo CME ‏@halocme Tweeted
Almost circular halo CME (Earth-directed, expected arrival June 23/24). It was associated with M flare. Nice dimming.


SolarHam ‏@SolarHam Tweeted
CME originating from flare site tonight appears to be full halo and Earth directed. More to follow.


SpaceWeatherLive ‏@_SpaceWeather Tweeted
A full halo CME is now becoming visible from the M2.0/M2.6 flare. Impact at Earth very likely. More later.


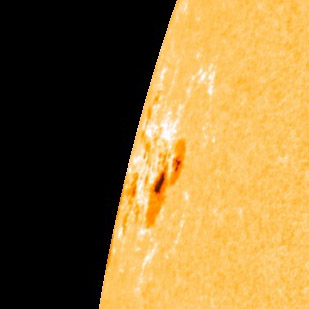
sunspot 2371 with earth to scale, captured today by Philippe Tosi.
 

Monday, 8 June 2015

Minor geomagnetic storm

G1 - Minor geomagnetic storm (Kp 6-) - High latitude sky watchers have a chance to see visual aurora. The higher middle latitudes might see aurora on the northern or southern horizon, depending on which hemisphere you are located. 


Aurora Forecast For The Northern Hemisphere
 

Tuesday, 5 May 2015

M1.9 solar flare from sunspot region 2339, incoming CME?

M1.9 solar flare from sunspot region 2339, incoming CME?

Tuesday, May 5 2015 - 10:59 UTC
Old sunspot region 2322 which has received new sunspot number 2339 is now rotating back onto the earth-facing disk and it is still active. This sunspot region which was likely the source of numerous coronal mass ejections while on the farside of the Sun produced an M1.9 solar flare that peaked at 09:47 UTC.
The solar flare did not look eruptive and it likely launched no coronal mass ejection. A quick look at sunspot region 2339 shows lot's of faculae indicating this sunspot region could be in decay. We will get a better look at this sunpot region in the next 24 to 48 hours. This will give us a better picture so we can indicate if this region really is in decay and how complex it's magnetic layout is.

Image: Sunspot region 2339 (ex-2332) as seen in visible light by NASA SDO.
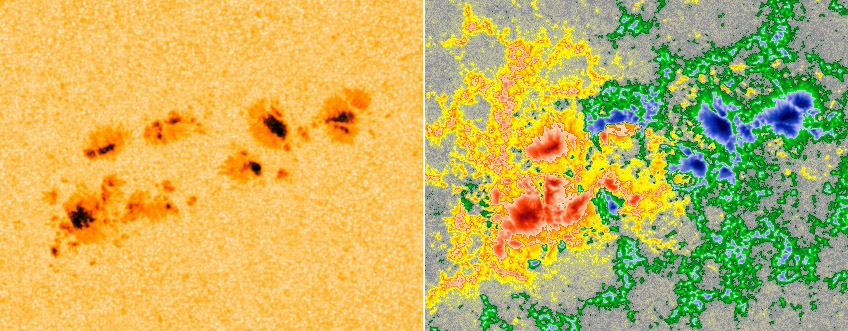
A honourable mention goes to sunspot region 2335 which is in an earth-facing position right now. This sunspot region has been growing slowly and now has one magnetic delta structure and one delta structure candidate. It has yet to produce an M-class solar flare but it could very well do so in the coming days. It is complex enough for a low-level M-class solar flare. Keep an eye on this sunspot region as well as an eruption from this sunspot region has a good chance of coming towards our planet.

Images: Sunspot region 2335 as seen by NASA SDO. Visible light (left) and magnetogram (right).

Incoming coronal mass ejection?

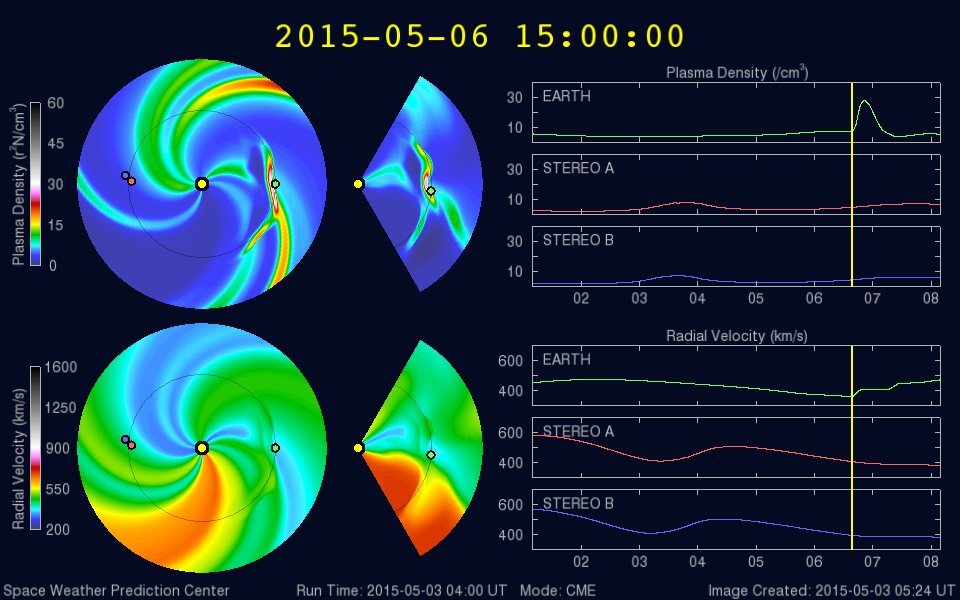
A weak coronal mass ejection from a filament eruption that occured a few days ago could arrive in the coming 12 to 36 hours. The low energy protons and electrons as measured by ACE EPAM are rising indicating an approaching plasma cloud. The coronal mass ejection is heading mostly south of Earth as seen on SOHO coronagraph imagery but a weak glancing blow can not be excluded. Geomagnetic storming is not expected. Below a still of NOAA's ENLIL model showing the incoming CME.


Image: NOAA's ENLIL model showing a possible glancing blow CME passage.

Tuesday, 21 April 2015

Three M-class solar flares, CH effects, CME watch

Three M-class solar flares, CH effects, CME watch

Tuesday, April 21 2015 - 14:11 UTC


Three low-level (R1) M-class solar flares took place today, all of them located at or near the east or west limb of our star.
The first of these solar flares was an M1.0 solar flare at 07:21 UTC from departing sunspot region 2322. Sunspot region 2322 has been growing rapidly during the past 24 hours but as this sunspot region is now turning away from Earth, we have to conclude that any future eruptions from this sunspot region will not be directed towards our planet.
The second M-class solar flare was an M2.2 event at 10:40 UTC but it did not come from sunspot region 2322. A new sunspot region behind the east-limb was the source of this event. SDO imagery shows that is was a pretty violent event and it likely released a coronal mass ejection that is directed away from Earth.
The third and final M-class event of today (thus far... the day isn't over yet!) was also an M2.2 event. This solar flare peaked at 11:57 UTC and came from departing sunspot region 2322. It did not look eruptive but because this was also a limb event, any resulting coronal mass ejection will not be directed at Earth. Below you can watch a video by SDO showing the three M-class solar flares. The three flashes on the limbs are the M-class solar flares.

Monday, 6 April 2015

Filament eruption - Sunday, April 5 2015 - 13:18 UTC


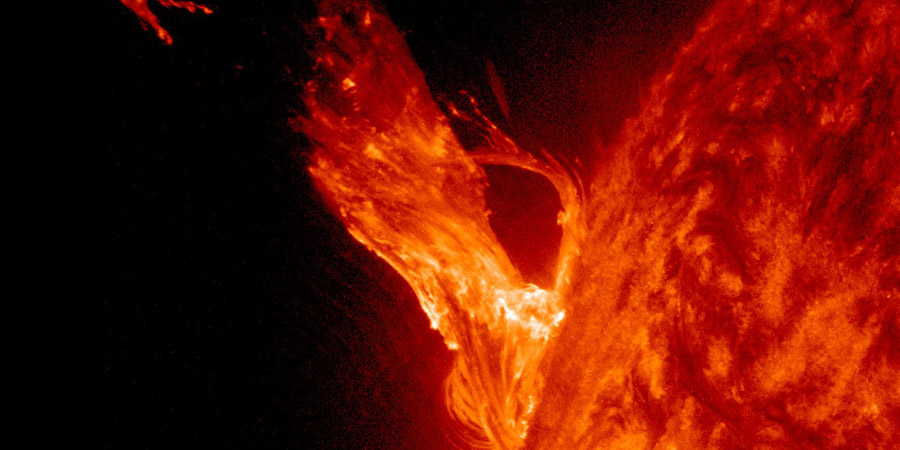
As Saturday turned into Sunday, the easternmost part of the large filament channel that was facing Earth erupted and launched a coronal mass ejection into space. The big question is: does this eruption have an earth-directed component?
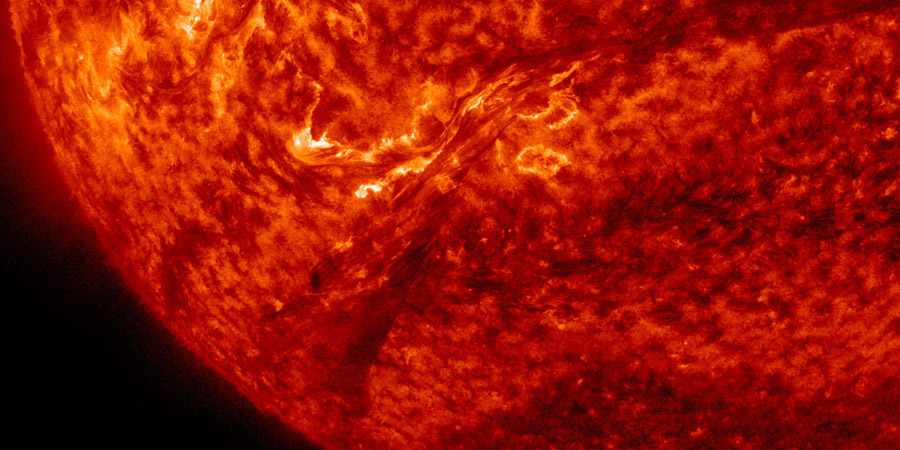
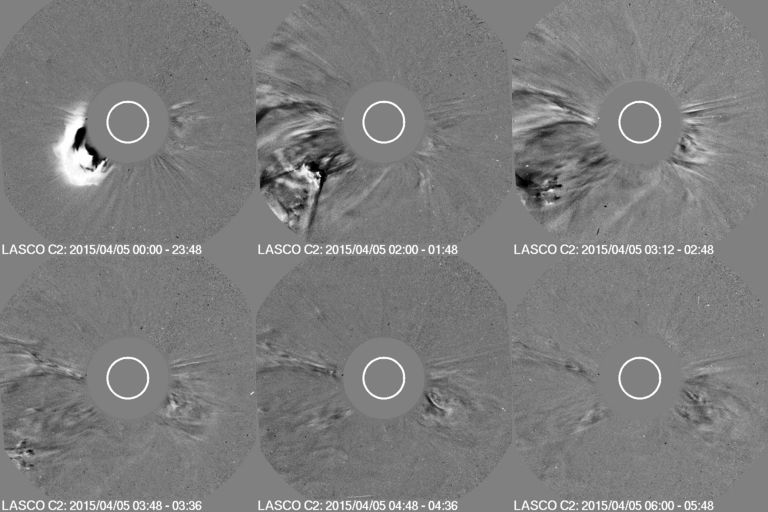
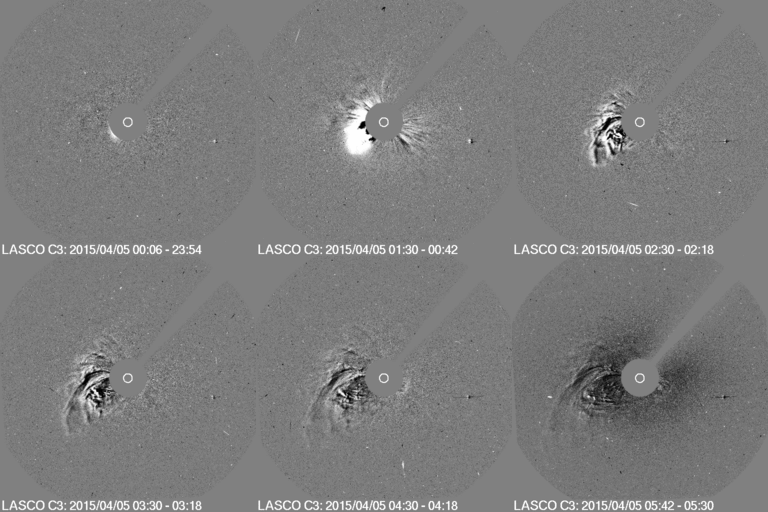
First things first: solar activity remains low with no sunspot regions on the disk which could produce a strong solar flare. In fact, this filament eruption was associated with the largest X-ray event of the past 24 hours. A C3 hyderflare followed after the filament disappeared. Based on imagery from SDO we could conclude right away that most of the material would travel to the south-east and miss Earth, something that SOHO confirms. Coronagraph imagery from SOHO shows that the coronal mass ejection does expand to form a partial halo of more than 180 degrees but the halo does not expand to form a full halo meaning we will see a glancing blow from this coronal mass ejection at best. Based on the speed of the eruption which is estimated to be around 700km/s we can conclude that a glancing blow is possible late on Tuesday or perhaps early on Wednesday. We do have to note that only a very minor part could have an earth-directed component and this shock passage will likely not be strong enough for a geomagnetic storm.


Images: Coronagraph imagery from SOHO/LASCO C2 (left) and C3 (right) showing the coronal mass ejection associated with the filament eruption.


Solar filament eruption that caused the coronal mass ejection that's arriving tomorrow.

 
Coronal mass ejection, caused by the major solar filament eruption, will be bringing us a solar storm in 24 hours.

Wednesday, 18 March 2015

Strongest geomagnetic storm of solar cycle 24

Wednesday, March 18 2015 - 16:28 UTC 

17 March 2015. That is the date that will be remembered by many people all around the world who witnessed one of the most intense auroral displays in years. What looked like a fairly average coronal mass ejection from only a C9 (!) solar flare that would give us a glancing blow and spark at most a minor G1 geomagnetic storm actually caused the strongest geomagnetic storm of solar cycle 24. Three periods were recorded yesterday where the severe G4 geomagnetic storm threshold was reached. The Dst or disturbance storm time index (which just like the Kp-index is a way to record the severity of a geomagnetic storm) reached -228 during the peak of the storm close to midnight UTC and means this storm was actually much stronger than the second strongest geomagnetic storm of solar cycle 24 that reached -147nT on 25 October 2011. We thus witnessed a unique event! Tech talk aside: a geomagnetic storm of this size gave many people around the world the chance to see the magical polar lights and capture them with their own cameras. We have been overwhelmed by all of your images that we got in our inbox. Thank you very much! Keep on reading for a selection of the most amazing images that we received of what truly was one of the best geomagnetic storms in years.


United Kingdom

Mark Ferrier (Balnakeil Beach Durness, Scotland)

Maciej Winiarczyk (Scotland)

Graham Telford (Durness, Scotland)

  Gary Pescod Photography (Derwent Reservoir)

Tuesday, 17 March 2015

Space Weather Alert: Geomagnetic K-index of 8 (G4)

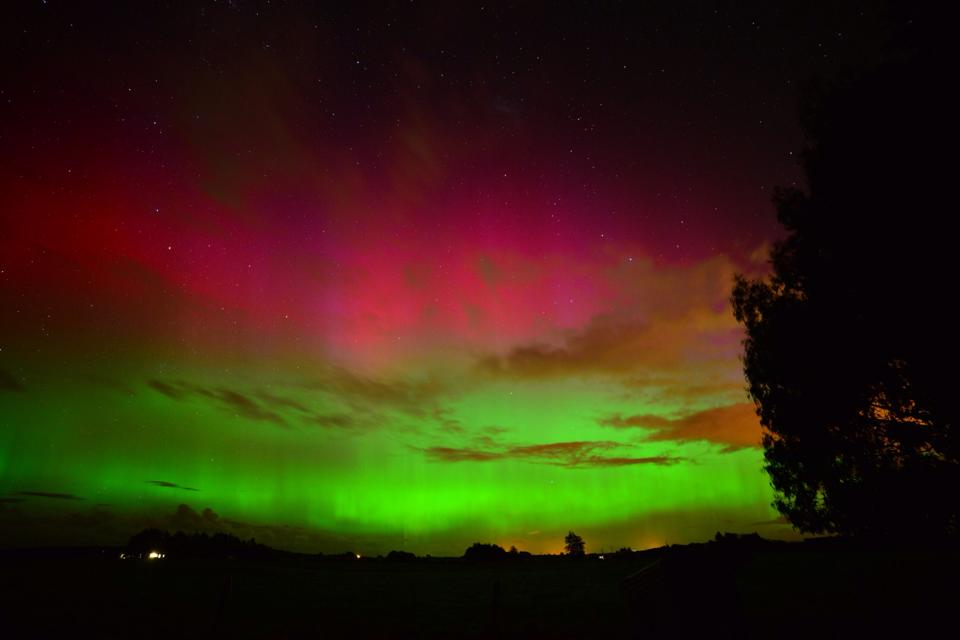
Image: Aurora Australis captured only moments ago by Eddie Griffiths from New Zealand.
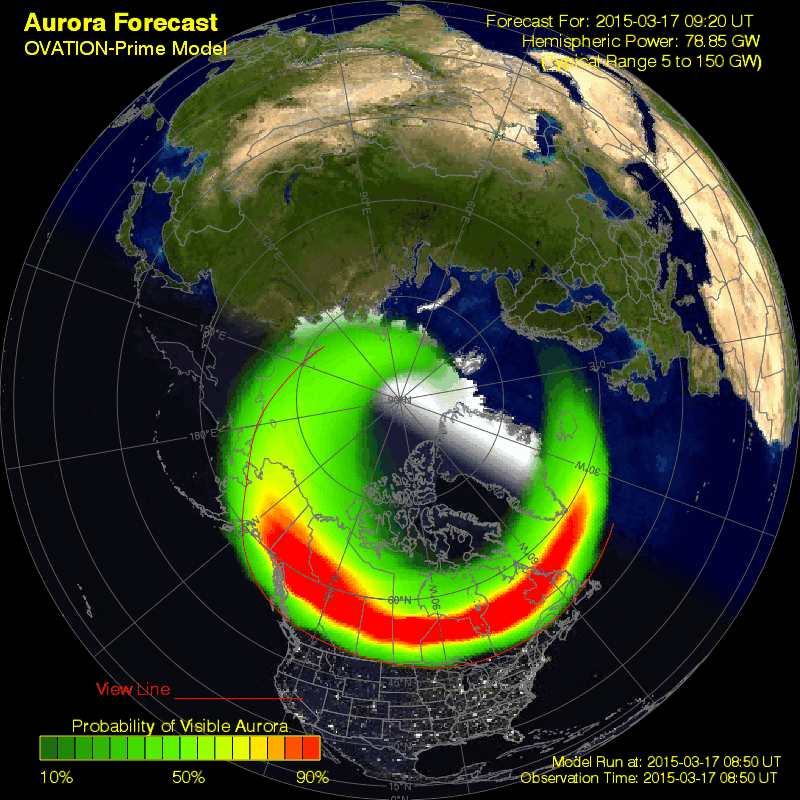
 Image: OVATION model run for the northern hemisphere valid at 2015-03-17 09:15 UTC.

The coronal mass ejection likely associated with the C9 solar flare has arrived at Earth, much earlier than expected. A sudden increase in the solar wind and IMF parameters were observed but the direction of the IMF stayed north until around 06:00 UTC when it turned southward for a couple of hours to about -20nT. The geomagnetic field responded and a moderate G2 geomagnetic storm followed.

Current conditions

Coronal mass ejection effects continue at the time of writing with the solar wind speed being close to 600km/s and the strength of the IMF being close to a high value of 25nT. The direction of the IMF is however pointing north now around 12nT which should cause the geomagnetic conditions to calm down a bit in the hours ahead. Nonetheless, the geomagnetic field is disturbed and more auroral outbreaks are possible. Sky watchers in Tasmania and Victoria (Australia) and the southern island of New Zealand along with the upper United States should remain alert for aurora providing skies are clear at your location.
It is still too early to tell what European sky watchers should expect but CME effects will likely persist for another 12 to 24 hours. The direction of the IMF could very well turn southward in the hours ahead which could spark more aurora over Europe this coming evening. Keep an eye on the stats as European evening hours approach.